Despite living in an increasingly urban, technological society the weather remains important to all of us, and especially to those who venture onto open water. Despite the impressive engineering that goes into modern yacht design, the advancements in fly-by-wire joystick controls, thrusters and digital instrumentation, all can still be rendered impotent by the overwhelming forces of nature.
The importance of wind and its effect on water cannot be overstated, but more subtle effects such as fog should not be ignored. Savvy, cautious mariners not only examine forecasts before they throw off their lines, but continue to keep an eye on the weather once out on the water.
Although there is a certain degree of chaos in weather systems, there is also a great deal of structure and pattern, and it is crucial to understand these to keep safe on our coastal waters.
The Big Picture
Anyone who has spent any time on the West Coast will be familiar with our dominant weather pattern, which depending on the time of year usually means a lot of rain. We do, after all, live in a temperate rain forest. Most notice that winter has the most wind and rain, while summer is often a period of warm calms. Massive, global atmospheric structures are responsible for this phenomenon.
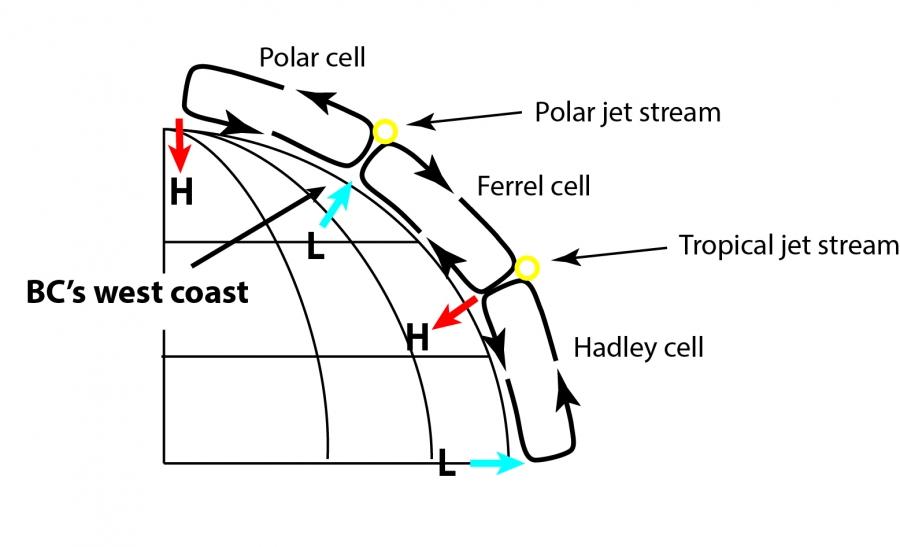
In the northern hemisphere, two large regions of air—cold dry polar air and warm moist subtropical air—meet at around 60 degrees north, although this is highly variable and changes with the season. The interface where these two air masses meet is a definite boundary because the temperature and density difference prevents mixing.
This boundary circles the globe, and marks the location of the upper air Polar Jet Stream, which is the track of cyclones or the low pressure regions that we see march in regular procession against our coast, especially in winter. These cyclones are the primary method of heat transfer from equatorial regions toward polar regions. Without the mixing provided by these cyclones, the poles would be much colder and the lower latitudes much hotter.
This global circulation pattern results in the air rising at the interface of the Polar and Ferrel cell, and this rising air allows continual formation of the low pressure regions we see in our higher latitudes. At 30 degrees latitude, the circulation flows downward and creates long-term high pressure, and the perpetually sunny and dry conditions we see at those latitudes.
As the polar jet stream races west to east around the globe, it carries with it alternating high and low pressure regions against the West Coast of North America. This process accounts for most of our large scale weather patterns, and it is the pressure difference between regions of high and low pressure that causes air flow. The greater the difference between the two, the stronger the winds will blow between them.
Understanding the formation of high and low-pressure regions are therefore crucial to understanding West Coast weather.
Ground-Level Weather Starts High Above Cyclones and anticyclones begin in the upper-level region known as the tropopause, between nine and 17 kilometres above the surface.
These regions of high and low pressure are linked by a circular loop of falling and rising air. Where cool air falls toward the surface, it generates pressure, creating an anticyclone with winds radiating outwards. The falling air warms and moisture is evaporated, creating clear conditions. The Coriolis effect bends these outward-flowing winds, making them rotate clockwise. This is how anti-cyclones form.
On the opposite side of this loop, warm air rises to replace the air flowing down into the anti-cyclone. This rising air creates a low-pressure region at the surface, with inward flowing winds. This rising air cools and moisture condenses out, creating clouds and precipitation. Here the Coriolis effect causes these winds to rotate in a counter-clockwise direction. This is called a cyclone [IS THIS RIGHT?]
The opposite direction of wind flow between an anticyclone and cyclone accounts for the fact that summertime winds, dominated by a high pressure ridge offshore, usually flow from the northwest, while wintertime winds generally caused by cyclones, flows from the southeast.
These cyclone-anticyclone loops follow the jet stream, which constantly changes latitude both daily and seasonally. In the summer, a semi-permanent ridge of high pressure called the North Pacific High moves further north, pushing the jet stream to higher latitudes. This is why further north you can still get a great deal of precipitation in the summer, while in the south coast we can almost always count on sunny, calm days.
In the winter, a semi-permanent low called the Aleutian Low builds in the north Pacific ocean, the North Pacific High drops to lower latitudes, and the storm track moves south, aimed squarely at the south coast.
The Cyclone Life Cycle Although local conditions can dramatically alter winds, generally cyclones account for stronger winds than anticyclones, and wintertime lows are the deepest, which is why winds up to hurricane force are not uncommon in the winter months on the exposed coast. In the summer, the storm track is further north, and the lows produced are not so deep.
Because they account for most of the dangerous winds and poor visibility due to rain, understanding the cyclone life cycle and being able to read weather charts is important to predicting the weather. The boundary between cold dry polar air and warm moist subtropical air is called a front. A cyclone contains both a cold front and a warm front. Because of these two fronts, weather can change dramatically and quickly as a cyclone passes.
As a cyclone begins to develop, the rotation of the rising air causes the front to develop a kink, evolving into the classic wedge shape common in weather maps. The warm moist air flows north and climbs above the denser cold air. Moisture then condenses out as rain because of both adiabatic cooling of the rising air, and cooling caused by contact with the colder air below. Behind the warm front, cold dry air drops south and follows as a cold front. The area between the two fronts is unstable and often brings precipitation. The leading edge of the cold front pushes against the warm moist air ahead of it, and creates yet another line of precipitation, but with clearer, cooler air behind it. Clearing generally follows the passage of a cold front.
The longer the cyclone lasts, the more the cold air front catches up to the warm front—because of it’s greater density it moves faster. It eventually overlaps it, and the cyclone dissipates. This is known as an occluded front. There is often precipitation along an occluded front due to a remaining pocket of warm moist air sitting atop the mass of colder air.
In Application A weather chart will show how old a cyclone is: a kink in the front means it is weak and/or just forming. A classic wedge shape shows the cyclone is mature, and an occluded front means the storm is petering out and winds can be expected to diminish.
Any low with a pressure near 980mb can be expected to generate gale force winds, and that’s aside from any land-based effects. As air pressure drops, wind speed increases. But because wind is caused by differences in pressure, a more moderate low close to a high can generate equally strong winds.
Because a cyclone circulates counterclockwise, you can look at a weather map and have a pretty good guess which direction the wind will blow depending on the location of the low. This is important because as a front passes and the wind backs or veers, the long fetch along a strait can produce dangerous waves, yet when the same wind blew across it, all you had to contend with was a light chop.
Knowing the speed of an approaching front is crucial to anticipating future changes in wind direction.
Reading Weather Charts
The Canadian federal government publishes daily weather maps predicting the path and location of systems. Those a mariner needs are called surface analysis maps.
Low pressure centres are marked with a large L and high pressure centres with a large H. Pressure graduations between these are indicated by isobars, which are lines that join locations of equal atmospheric pressure. The closer a series of isobars, the sharper the pressure gradient and the stronger the winds can be expected to blow from the region of higher to the lower pressure.
A good analogy is a topographical map of a physical slope—the steeper a slope, the closer a topo map will show lines of elevation, and the faster a ball will roll down that slope.
Along with isobars, weather maps are populated with a huge number of possible symbols that show local weather. The most important are reported weather station symbols, represented as a circle with a tail surrounded by a variety of numbers. These numbers show local details such as dew point, cloud type, temperature and so forth.
Of most interest to the mariner are wind direction, wind speed and pressure tendency. While the tails show the wind direction, the tail barbs show the wind speed in knots, each line representing 10 knots, each half barb five knots.
Weather analysis maps are generated for 00, 06, 12, and 18 hrs Co-ordinated Universal time. These maps allow you to look at what meteorologists expect will be happening several hours in the future, so you can see the predicted path of fronts and weather systems.
As well, specific marine forecasts are generated for the entire coast, broken down into several regions, complete with a synopsis, a summary, a forecast, and a map giving hourly weather reports from various land-based stations, lighthouses and marine buoys. Most offshore data come from ships and aircraft. It is crucial to become familiar with these resources.
Local Effects
So far we have looked at large-scale weather patterns affecting the West Coast. While these generally hold true, their effects can be profoundly altered by regional geography, especially with the mountains, straits and deep fjords that mark our coast.
Like all fluids, moving air follows the path of least resistance and so is channelled by geographical features. This is why the strongest winds in the great coastal straits and inlets almost always travel lengthwise along the path of the waterway. This also means that winds will often be set against tides, resulting in significantly larger seas than one might expect based on just wind speed alone.
Headlands, tall mountains and valleys all have the ability to deflect and change winds from the dominant air flow, and in conditions of strong winds these features must be approached cautiously. Topographical features can be as important as sea depth features on a nautical chart. Brooks Peninsula and Cape Cook on the northwest coast of Vancouver Island are notorious for erratic, powerful winds as the headland blocks prevailing northwesterlies and southeasterlies, creating violent lee eddies and strong wind sheer across the capes.
Adiabatic Winds [QUICK DEFINITION HERE] These can be very powerful, even in times of fair weather. Daytime heating causes land air masses to rise, and cool sea air rushes in through narrow channels to replace it. In clear, warm summer afternoons the Juan de Fuca Strait can experience winds up to gale force as Pacific air rushes in to replace air rising over mainland valleys.
Mainland heating can cause winds to flow up Alberni Inlet, cross Vancouver Island and down Qualicum Valley to rush across the Strait of Georgia. Called Qualicums, these can be very sudden and dangerous winds in an otherwise calm day.
The effects of topography on wind can be very difficult to predict. Narrow channels that open into wider areas, large valleys that open toward the water, Steep-to areas protruding into more open regions are all places where winds can become unpredictable. It is not uncommon for a mariner to anchor in a deep-sided inlet believing they are well snugged-in for the night, only to discover gusty, erratic winds that box the compass and make for a disappointed sleep.
Dropping temperatures can cause katabatic winds to suddenly flow out of a valley at night and reach surprising force. It’s always a good policy to give yourself lots of scope on your anchor rode when anchoring in areas that are infrequently used or where you are unfamiliar with wind effects on the anchorage.
Fog can be created by several reasons, but in all cases it is caused by an air mass reaching the dew point at ground level. More than one type can exist sequentially or even simultaneously. Along the B.C. coast there is a more-or-less semipermanent band of fog caused by warm moist air moving over cold Pacific water.
The cold water chills the air at the surface, causing the boundary temperature to drop until the dew point is reached. This is advection fog. As well, the night time clear and calm conditions typical under a summer high create the deep cooling needed for fog formation. This explains why offshore fog seems to roll in at night, and then burn off later in the day. This is radiation fog and gives rise to our famous “fogust.”
Fog is an ever-present reality on the outer west coast and a mariner needs to be prepared for it in any season. But because the sea warms as it enters the waterways behind Vancouver Island, advection fog is less common on more protected inlets and waterways. Fog can sometimes block the entire Juan de Fuca Strait at Race Rocks, while by Trail Island it has all but dissipated.
Clouds When warm, moist air arrives at our coast, it is deflected upwards by the Coastal Mountains. Rising air cools, and as it does so the moisture in it reaches its dew point (100 percent humidity) and condenses into tiny droplets. This generates clouds. If the cooling happens at ground level, we call it fog. Clouds can be an excellent indicator of atmospheric stability, and therefore current and future weather.
Cloud Triangle The cloud triangle is a good model of atmospheric state. The sides of the triangle indicate increasing elevation, with cirrus at the top. The left side of the triangle represents stable air masses, with stratus on the bottom corner, while the right side indicates unstable air with cumulus on the bottom. The socked-in drizzly days common on the coast come from stratus clouds, while the violent storms common on the summer prairies come from varieties of cumulus clouds. Stratus clouds tend to be slow moving, while cumulus tend to be quicker and can generate sudden, violent weather.
Summer cumulus storms are fast with heavy rain while winter stratus can provide long days of precipitation. While high clouds can be useful for weather prediction, they won’t bring rain; it is low clouds that are responsible for precipitation.
Sheet-like cirrostratus may indicate approaching bad weather, while cirrocumulus clouds indicate fair weather. As we move further down the left side triangle the greater the chance of bad weather. Nimbostratus is the classic rain cloud. Cumulus clouds on the right generally indicate fair weather as long as they don’t begin to rise. The greater the vertical movement, the more unstable the air mass, and the greater the likelihood of a sudden, intense storm with dangerous winds. Fortunately, such thermally-generated storms are rare along the coast.
Climate Change With the increase in the mean surface temperature, the engine of weather is being strengthened. The weather along our coast exists primarily because of temperature or energy differences between polar and tropical regions, and as the earth’s atmosphere warms, more energy will be transferred poleward. While this may not actually increase the number of storms, it is thought that as more energy is transferred, the more powerful the storms will become.
We see this already in the tropical cyclones, monsoons and hurricanes that dominate weather systems in warmer latitudes—the greater energy of the tropics generates much more powerful storms than we see in our northern latitudes. Expect that to change.
What this means to the mariner is that weather, already a dominant force, will likely become even more dramatic and unpredictable on the West Coast. Knowing and understanding weather will only become more important.